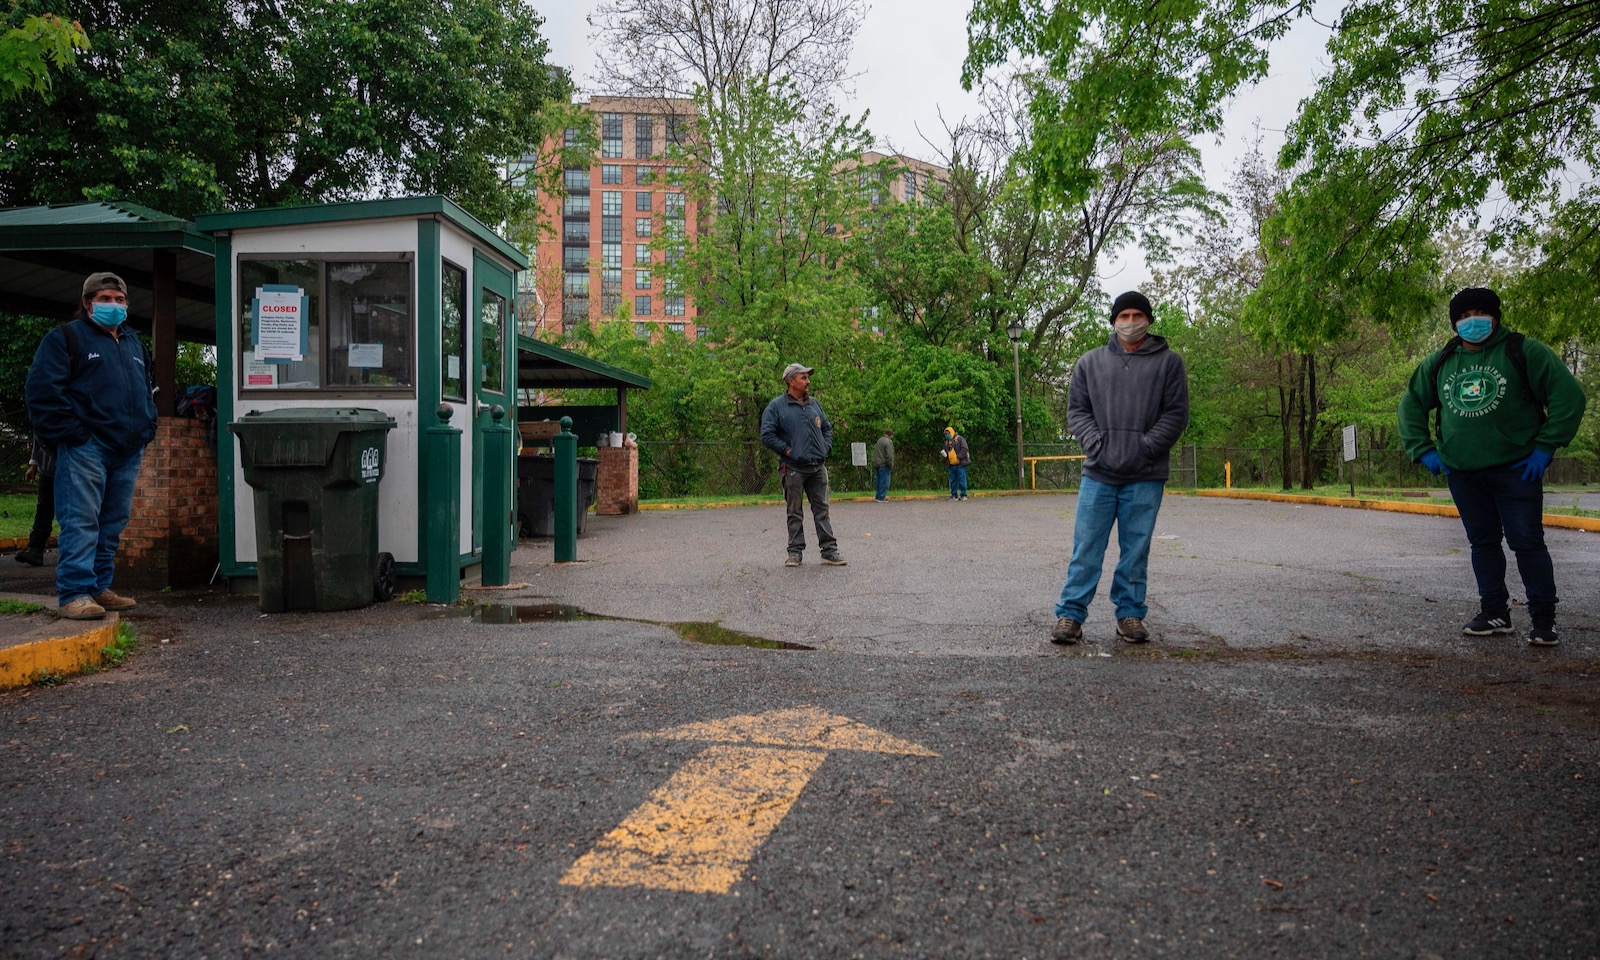
Andrew Caballero-Reynolds/AFP via Getty Images
Day laborers waiting in a parking lot during the week the US unemployment rate hit nearly 20 percent, Arlington, Virginia, May 6, 2020
On Friday, the Bureau of Labor Statistics (BLS) published harrowing data on the labor-market consequences of the shutdown, based on survey data on households and firms taken in the calendar week that included April 12. This, though, is by no means the end of the bad news. On June 5, the BLS will publish data for May that we know is going to be even worse—not least because we know that claims for unemployment insurance are continuing. In the state of Texas, for example, initial claims were 274,000 for that second week of April, and averaged more than 260,000 a week in the three weeks since then.
The data are hard to interpret because any idea of “normal” has gone out of the window. A labor economist is what you need to pick your way through this new statistical landscape where everything has changed.
Let’s start with data from firms and establishments. First, there was a big decline in the numbers of jobs reported by firms (the so-called non-farm payrolls) of 20.5 million. Employment declines were especially high in the retail trade and health care: each fell by around 2 million; in food and drink services, which includes restaurants, bars, and cafés, things were even worse, down 5.5 million. Even government jobs were down by nearly a million. Amid this extraordinary turbulence, there were a few quirks—including a rise in the average number of hours worked from 34.1 to 34.2, even though total hours worked fell by 15 percent, and hourly earnings were up more than 7 percent. The reason for these apparent anomalies was that the low-paid and those on fewer hours are the workers most adversely and disproportionately affected by the shutdowns.
The household account gave us gruesome detail about who has felt the worst impact. And it’s important to note that the household account captures a broader picture than the firms’ data does, since it covers the self-employed and household workers who are especially affected as the economy turns downward. Employment according to that account fell by 22.4 million.
Those at the lower end of the wage scale who, in aggregate terms, can benefit most from a boom are the hardest hit in the slump. The first number that hit the headlines during this pandemic crisis was the rise in total unemployment of 15.9 million to 22.5 million, which resulted in a rise in the unemployment rate from 3.5 percent in February, to 4.4 percent in March, to 14.7 percent in April. In reality, the unemployment rate has been even higher.
The BLS explained in its release with Friday’s figures that in fact an additional 7.5 million workers “wrongly” reported that they were employed but absent from work. (The BLS had given special instructions to household survey interviewers for all employed people absent from work due to coronavirus-related business closures should have been classified as unemployed on temporary layoff. But the BLS didn’t correct the numbers and simply reported what people said.) Adding those 7.5 million to the 22.5 million actually reported, to get a total of 30 million jobless, and then dividing by a labor force of 155.8 million results in a true unemployment rate of 19.3 percent.
Such a number is unprecedented in most people’s lifetimes. In the crash of 2007–2008, it took nearly two years for the unemployment rate to double from 5 percent in December 2007 to 10 percent in October 2009. This time, the rate has quintupled in eight weeks. The only comparable numbers were in the Great Depression, but even then, the increase took much longer. The annual unemployment rate in the US was 3 percent in 1929, 9 percent in 1930, 16 percent in 1931, 24 percent in 1932, and 25 percent in 1933. By 1941, just before the US entered World War II, it stood at 10 percent. So we may be facing a very long haul out of this abyss.
The concern is that the most vulnerable are the worst affected—much as they are in terms of the death rates from the Covid-19 virus—and this is indeed what we are seeing. The unemployment rate of those with less than a high-school diploma jumped from 6.8 percent on the month to 21.2 percent; and for high-school graduates, it went from 4.4 percent to 17.3 percent. For those with some college education, the numbers rose from 3.7 percent to 15 percent; and for college graduates, from 2.5 percent to 8.4 percent. The Hispanic unemployment rate rose particularly steeply, from 6 percent to 18.9 percent.
There is a special concern about young people, who are going to struggle to make the transition from school to work. We know that a long spell of unemployment when you are young creates a permanent scar—reducing earnings for decades and increasing the risk of adverse life events. Even for those with college education, the graduating class of 2020 from universities is going to have a tough time. But minority youngsters with less education are going to be especially hard-hit. For many, in the past, one response to a bad labor market is to go back to school—but that doesn’t look that attractive right now.
Advertisement
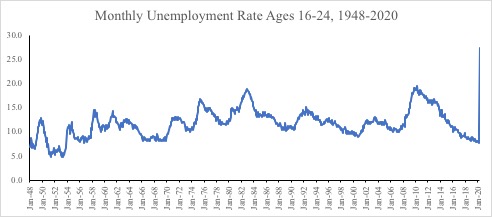
This graph charts how bad the situation is. It plots the monthly unemployment rate for those aged sixteen to twenty-four from when records were first kept, in 1948. In April, the rate for this cohort rose to 27.4 percent, and it is hard to see it doing anything other than rising further for the foreseeable future. The class of 2020 does not even show up in the data yet.
It is hard to describe what we are seeing in these data as anything other than an unfolding disaster. The young are my greatest worry.