

Mary Ellen Mark
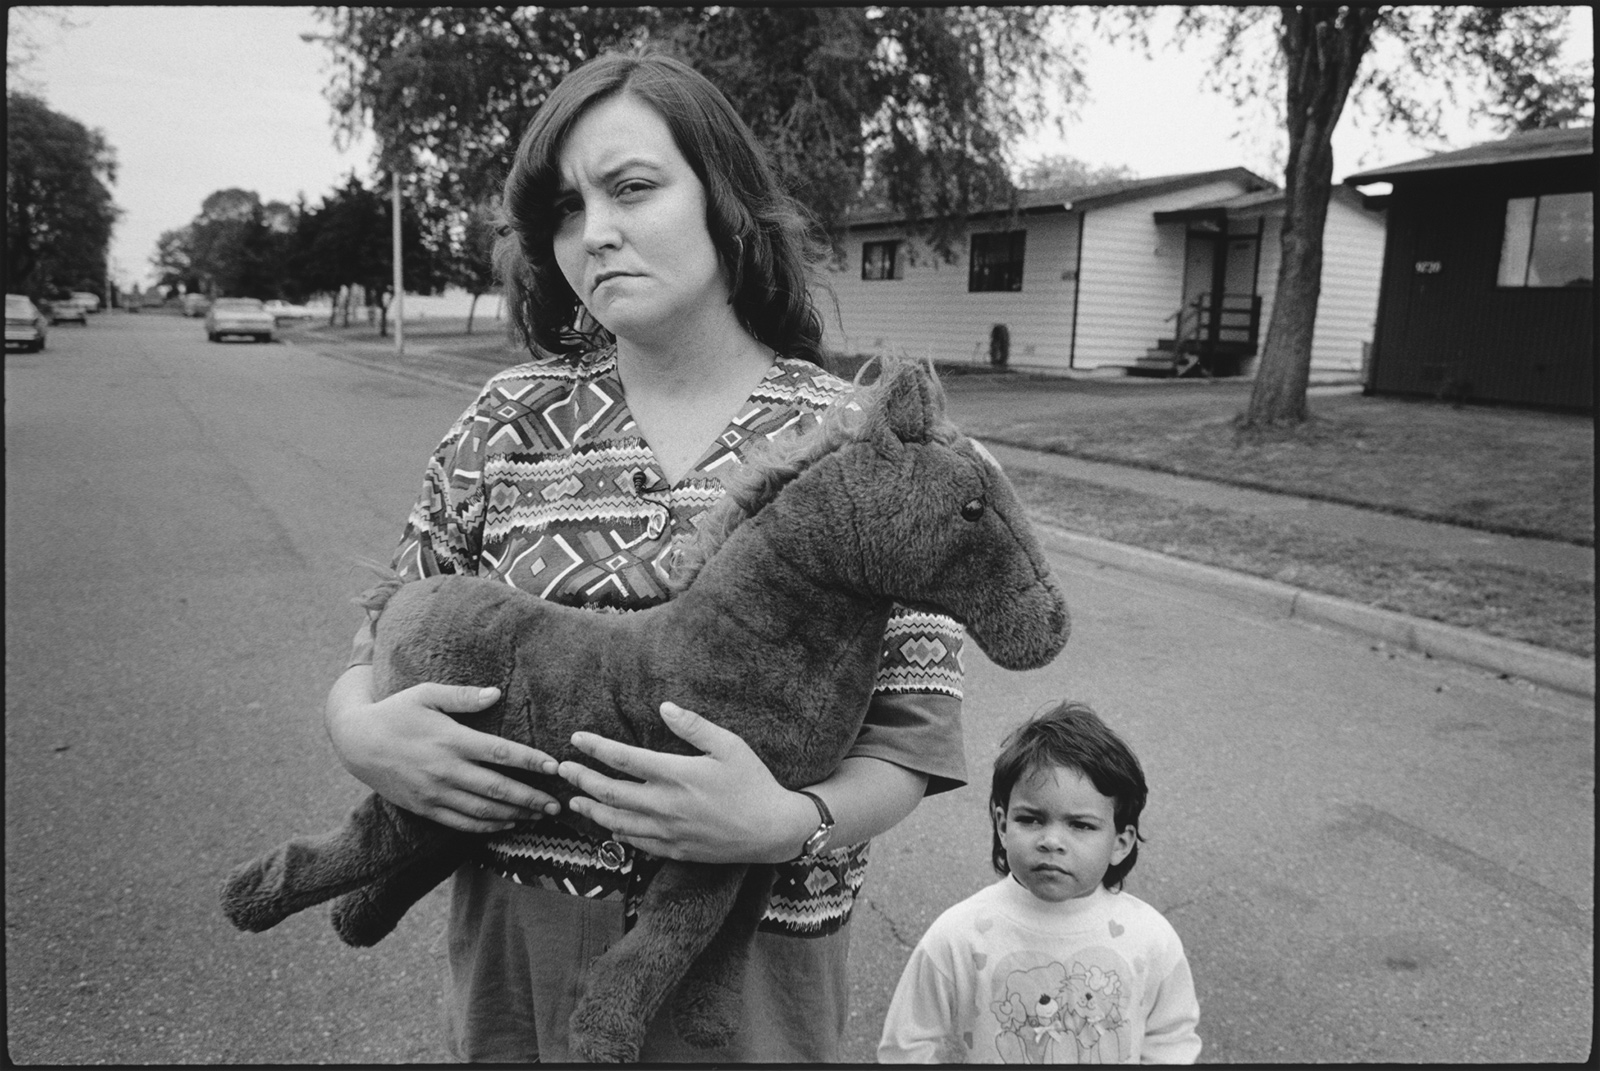
‘Tiny holding Horsey with Keanna,’ Seattle, 1993; photograph by Mary Ellen Mark from the exhibition ‘Tiny: Streetwise Revisited,’ at the Aperture Foundation, New York City, May 26–June 30. The book includes essays by Isabel Allende and John Irving and is published by Aperture. The film ‘Tiny: The Life of Erin Blackwell,’ made by Mark and her husband Martin Bell, will be shown at BAMcinemaFest on June 25.
According to the Census Bureau, the percentage of Americans living in poverty is higher today than it was in the late 1960s. Last year I argued in these pages that these “official” poverty statistics are extremely misleading.1 When the United States first explicitly defined an official poverty line in 1969, it was supposed to be adjusted every year to ensure that it represented a constant standard of living. However, two problems arose and were never fixed.
First, the Consumer Price Index, which was supposed to be used to adjust the poverty line for inflation, turned out to have flaws that made it rise faster than the cost of living. Second, the official measure uses pretax money income to measure families’ economic resources; but anti-poverty measures enacted since then, such as the expansion of food stamps and then the Earned Income Tax Credit (EITC), made low-income families’ total economic resources increase faster than their pretax money income. As a result of these problems, roughly half the families now counted as officially poor have a higher standard of living than families with incomes at the poverty line had in 1969.
In $2.00 a Day: Living on Almost Nothing in America, Kathryn Edin and Luke Shaefer argue that what they call “extreme” poverty roughly doubled between 1996 and 2012. If they are right—and I think they are—the reader might wonder how I can still claim that poor families’ living standards have risen. The answer is that inequality has risen even among the poor. Half of today’s officially poor families are doing better than those we counted as poor in the 1960s, but as I learned from reading $2.00 a Day (and have spent many hours verifying), the poorest of the poor are also worse off today than they were in 1969. $2.00 a Day is a vivid account of how such families live. It also makes a strong case for blaming their misery on deliberate political choices at both the federal and state levels.
1.
Kathryn Edin is a professor at Johns Hopkins University who has spent much of the past twenty-five years talking with low-income Americans about their lives.2 In 2010, when the national unemployment rate was over 9 percent, she began meeting parents who said they had no regular income whatever from work, from welfare, or from any other source. Their economic plight sounded worse than anything she had previously encountered, and she began pondering how to figure out what had happened, and why.
In 2011 Edin met Luke Shaefer, a young professor at the University of Michigan who had worked extensively with the Census Bureau’s Survey of Income and Program Participation (SIPP). This survey was the best available source of data on poor families, and Edin persuaded Shaefer to investigate what it showed about households with little or no income.3 To do that, they had to decide what criteria to use.
A single mother with two children was officially poor in 2011 if she reported an annual income below $18,123. If she reported less than half that amount, the Census classified her and her children as living in “deep” poverty. However, the Census had never had a term for families as poor as those Edin and Shaefer wanted to count, so they chose their own term: “extreme” poverty.
They also chose a third-world definition of who belonged in their new category. The World Bank counted third-world families as poor if they lived on less than $1.90 a day per family member. Edin and Shaefer rounded that up to $2.00.4 This cutoff was between 9 and 13 percent of the official poverty threshold for most American families. For a single mother of two, for example, Edin and Shaefer’s “extreme” poverty threshold was $6 a day while the “official” 2011 threshold came to just under $50 a day. Neither measure included noncash benefits or EITC refunds.
When Shaefer analyzed the SIPP data, he found that 4.3 percent of American households with children reported living on less than $2 a day per person for at least one month during 2011. When he looked back at the SIPP data for 1996, only 1.7 percent of parents had reported a month like that (see the first row of Table 1).

Edin and Shaefer were shocked by how much the SIPP estimate had risen, so they checked to see if other evidence pointed in the same direction. Their best comparison was with data collected by the Food Stamp Program. Families applying for food stamps must report their income to qualify for assistance, and they must then keep reporting it every year to remain eligible. The number of parents telling the Food Stamp Program that they had had a month without income matched the SIPP estimates closely in 1996 and 2005. From 2005 to 2012, however, the number of parents reporting a month without income rose faster in the Food Stamp Program than in SIPP.5 No one seems to know why the two trends diverged, but the divergence may mean that the 2011 SIPP estimates in Table 1 are too low.6
Advertisement
For reasons that will become clear momentarily, I now need to mention that Congress renamed the Food Stamp Program in 2008, calling it the Supplemental Nutrition Assistance Program (SNAP). The name change reflected the fact that the program now gives recipients an electronic card instead of stamps to pay for their groceries. Outside Washington, D.C., however, most people still talk about food stamps, not SNAP. I will do the same, except when I discuss the SNAP card itself.
The most obvious explanation for the increase in extreme poverty between 1996 and 2011 is that jobs were harder to find in 2011, but that is only half the story. Until 1996 single mothers with no income were eligible for Aid to Families with Dependent Children (AFDC). Edin and Shaefer argue that extreme poverty rose after 1996 because Congress replaced AFDC with an even less generous welfare program called Temporary Assistance for Needy Families (TANF). Because TANF benefits are much harder to get than AFDC benefits were, parents who cannot find a job are more likely to find themselves penniless.7
Prior to 1996 each state had its own AFDC program, with the federal government paying about half the cost in rich states and far more than half in poor states. States could set their AFDC benefits as high or low as they wanted, but in each state the eligibility rules had to meet a variety of federal requirements, one of which was that all legally eligible applicants were entitled to benefits. A state could not turn away eligible applicants because the legislature wanted to use the money for some other purpose or because a caseworker thought an applicant had loose morals.
All states still get federal money to cover part of TANF’s cost, but they now have more leeway in deciding how to spend such money. They can divert federal TANF funds to programs like financial aid for college students and pre-kindergarten programs, for example. Such programs are worthwhile, but they do nothing to help poor single mothers pay their electric bill or their rent. States also have almost complete freedom to decide what applicants must do to qualify for benefits and retain them. States can also shorten the federal time limit on TANF eligibility.
If states cut the cost of TANF by reducing the number of recipients, they can use the savings for other purposes. That gives state officials a strong incentive to discourage TANF applications. Potential applicants may have to spend weeks applying for jobs before they can apply for TANF. Or they may have to produce documents that they cannot find or do not know how to get. Understaffed welfare offices can create long lines that discourage applications. Many TANF applicants also report having been turned down with no explanation at all.
The opening chapter of $2.00 a Day describes a Chicago mother whom the authors call Modonna Harris. Harris graduated from high school and then took out loans to attend a private university. However, she got no financial help from her divorced parents, and when she hit her student loan ceiling at the end of her second year, she dropped out. Misadventures in love followed, and after her marriage broke up she had a child to support. The best job she could find was as a cashier, but after eight years her employer fired her because her cash drawer was $10 short. The store eventually found the missing $10, but it did not rehire Harris.
Harris looked for new jobs, without success. After her unemployment benefits ran out, a friend noticed that Harris had no food in her apartment for herself or her child and persuaded her to apply for TANF. The welfare office opened at 8:30 AM, so Harris showed up at 8:00. At least on that particular day, however, there were only enough appointment slots for applicants who had joined the line in the rain outside the welfare office before 7:30. After waiting most of the day, Harris left without having been given a chance to apply, convinced that TANF would never help her.
It is tempting to say that Harris was too easily discouraged. However, it is also tempting to say that in Illinois, as in most other states, TANF’s primary goal is not to protect children whose parents cannot find work by ensuring that their family has shelter, heat, light, food, and shoes, but to cut program costs by reducing the number of recipients. (California, which now accounts for a third of all TANF recipients, is a partial exception to this rule.)
Advertisement
State efforts to cut the TANF rolls have been quite effective. The overall unemployment rate, which is a fairly good proxy for how hard it is to find work, was almost twice as high in 2009 as in 1996. Yet the number of families getting TANF in 2009 was less than half the number getting AFDC in 1996.8 Edin and Shaefer write about meeting poor parents who said they didn’t know anyone who got TANF. Some parents thought welfare had been abolished, or that it was no longer accepting new applicants. This grim story deserves more attention than it has gotten, and Edin and Shaefer deserve a lot of credit for emphasizing it.
They also report a shift in social norms that may have made TANF shrink. When Edin interviewed single mothers in the early 1990s, they often told her that a good mother should stay home with her children. In 2012, even mothers who could not find work said they wanted a job rather than a welfare check, because a working mother set a better example for her children than a welfare mother did. This shift in attitude presumably encourages single mothers to keep looking for work, but it does not create more jobs for them. As a result, reducing access to TANF leaves more single mothers with neither a paycheck nor a welfare check. As Edin and Shaefer document in some of their saddest stories, such mothers often find jobs when times are good, but many of those jobs vanish when the economy slows. When single mothers can’t find work, they sell their plasma to hospitals and scavenge for cans and bottles in trash barrels. Sometimes they also sell sex or drugs. As a result, their income is usually meager and erratic.
One basic goal of welfare reform in the 1990s was to “make work pay,” and the Clinton administration created a new system that did just that. Instead of giving parents more help when they could not find work, the new system gives parents more help when they find and keep a steady low-wage job. When Modonna Harris worked as a cashier, Edin and Shaefer estimate that her take-home pay was about $1,325 a month. The government topped that up with another $160 a month in food stamps.
The Clinton administration also persuaded Congress to increase the Earned Income Tax Credit between 1993 and 1996, so when Harris was working she got a check from the US Treasury for about $3,800 a few weeks after filing her federal tax return. That check provided her with an additional $317 a month. Overall, the government supplemented Harris’s paycheck with benefits worth $477 a month. Once she lost her job, she stopped accumulating EITC benefits. Her food stamp benefits rose from $160 to $367 a month, but she was still getting $110 a month less than she had from food stamps and the EITC when she had a monthly paycheck.
2.
Edin and Shaefer’s descriptions of families in extreme poverty are both convincing and deeply troubling. However, two potential objections to their analysis deserve discussion. First, the estimates of extreme poverty in $2.00 a Day almost never include the value of food stamps, rent subsidies, or EITC refunds for work during the previous calendar year. Those omissions mean that Edin and Shaefer underestimate the resources available to most families in extreme poverty.
In papers published elsewhere Shaefer and Edin show how their estimates of extreme poverty change when they treat the value of EITC refunds, food stamps, and rent subsidies like income. The second row of Table 1 shows that including these resources reduces the estimated prevalence of extreme poverty among households with children from 1.7 to 1.1 percent in 1996 and from 4.3 to 1.6 percent in 2011. Because the reduction is so much larger in 2011 than it was in 1996, the increase in extreme poverty between 1996 and 2011 falls from 2.6 to 0.5 percentage points. In other words, the growth of EITC refunds and noncash benefits offsets about four fifths of the decline in extremely poor families’ pretax money income between 1996 and 2011.
Edin and Shaefer argue that we should not view a SNAP card that buys $500 worth of groceries every month as equivalent to $500 in cash, because the SNAP card can only buy food, whereas cash can buy whatever a family thinks it needs most. That is true. But if a family of three were given $500 in cash and used it to pay the rent, they would have to depend on local soup kitchens and food pantries to eat. Such institutions do not exist everywhere, and they are not open every day even in the places where they do exist.
I think Edin and Shaefer’s objection to treating food stamps like cash derives from a more fundamental problem, which is that a single mother with two children needs more than $500 a month to survive. If Edin and Shaefer were to treat a single mother’s $500 worth of food stamps like money, food stamps alone would represent about $16 a day in income. Because they have set the extreme poverty threshold for a three-person family at only $6 a day, treating food stamps like cash would mean that, according to the standard they have set, no family that got food stamps could be in extreme poverty, even if they had no money at all for rent, heat, clothing, or other necessities.
That problem cannot be solved by replacing $500 worth of food stamps with $500 in cash. Unless a single mother with two children has a federal rent subsidy that limits her payments to 30 percent of her income, she will need both $500 in food stamps to eat and another $500 (or more) for shelter and other expenses. A more transparent approach would, I think, be to adopt a broader measure of economic resources that included the EITC, food stamps, and the rental value of subsidized or owner-occupied housing, and then to set the threshold for extreme poverty at something like half the official poverty line.
Another concern about Edin and Shaefer’s estimates of extreme poverty in $2.00 a Day is that they include families whose income fell below $2 a day per person for even one month. If a single mother loses her job, has no relatives, no close friends, no romantic partner, and no assets she can sell or borrow against, one month without income can be catastrophic now that TANF is so hard to get. However, a single mother who has just lost her job often has some of those assets, as $2.00 a Day shows. When that is the case, her first month without income does not always mean that her family will go hungry, much less that they will all be put out on the street for not paying the rent. The longer she goes without income, however, the more likely she is to exhaust her relatives’ sympathy, her boyfriend’s willingness to bring over pizza for dinner, or the cash she had left from her EITC refund for her work during the previous year. There is no “one-size-fits-all” rule for deciding how long a family can survive without income, but for some, at least, one month need not be disastrous.
The fourth line in Table 1 shows that when Shaefer counted only those who had spent three or more months living on resources worth less than $2 a day, the prevalence of extreme poverty among households with children fell from 1.7 to 0.5 percent in 1996 and from 4.3 to 1.0 percent in 2011. This more stringent definition of extreme poverty among households with children clearly leads to a sharp reduction in its estimated prevalence. But it does not change the upward trend. The prevalence rises from 0.5 percent in 1996 to 1.0 percent in 2011, and the actual number rises from 189,000 to 373,000 households with children.
3.
The best way to visualize how the economic lives of low-income families have changed since the 1960s is to track the flow of economic resources to households at different percentiles of the distribution. Figure 1 focuses on the bottom half of the resource distribution, showing changes at the second, fifth, tenth, and fiftieth percentiles. Each group’s resources are shown as a percentage of its resources in 1967. The labels for the lines identifying each of these four percentile are shown in boldface.9 I omit the top half of the resource distribution, because the rising share of income going to the top 1 percent is already so well known. I also omit the bottom 1 percent, because of doubts about the accuracy of the estimates.
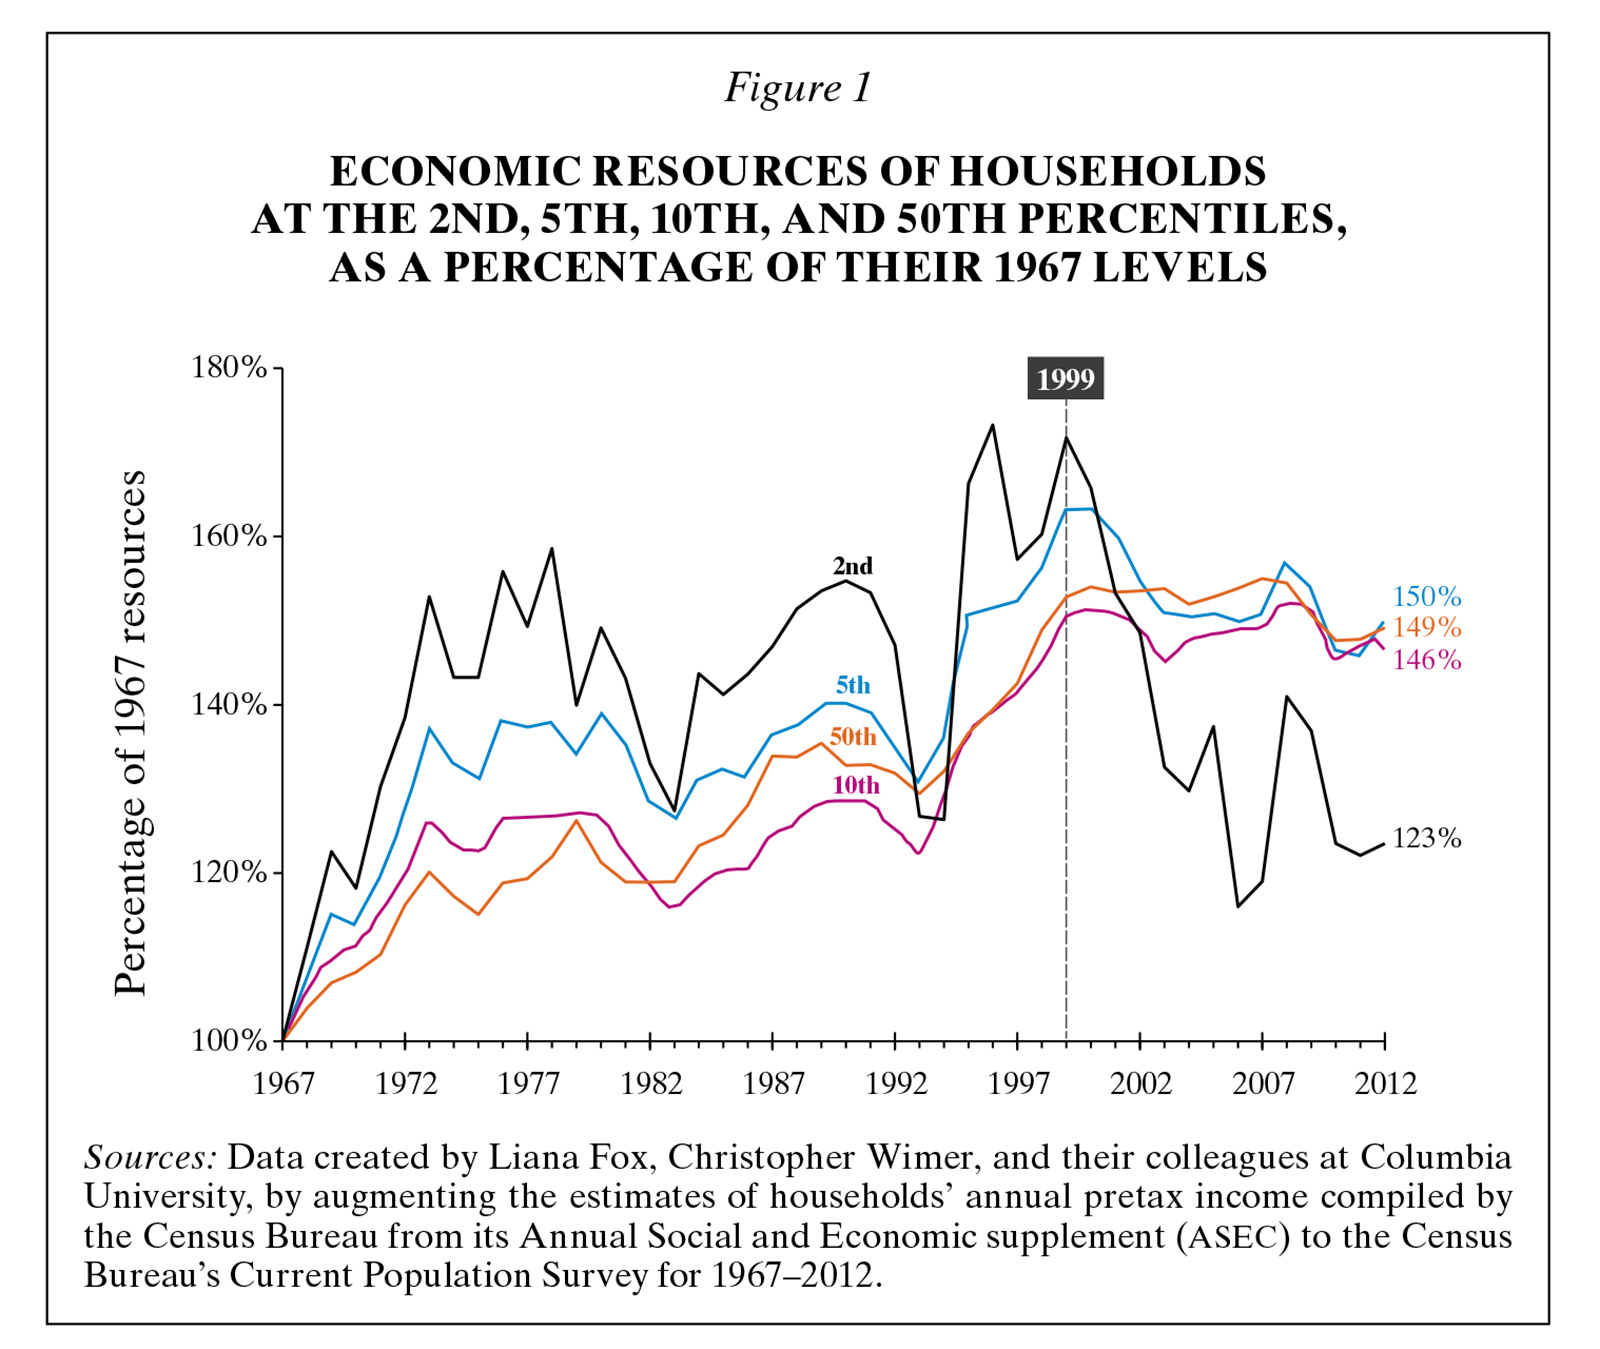
Between 1967 and 1999 the resources flowing to the second and fifth percentiles grew by an average of two thirds, whereas the resources of the tenth and fiftieth percentiles grew by about half. As a result, inequality between the bottom and the middle of the resource distribution narrowed. This narrowing was driven primarily by the growth of food stamps and the EITC.
After 1999 this egalitarian trend reversed. The second, fifth, tenth, and fiftieth percentiles all suffered some reduction in their economic resources after 1999, whereas Figure 1 shows that the percentage decline was much larger at the second percentile than at the fifth, tenth, or fiftieth percentile. The fifth, tenth, and fiftieth percentiles also received about 50 percent more resources in 2012 than in 1967, but the second percentile received only 23 percent more, wiping out two thirds of its gains between 1967 and 1999.
Figure 1 supports my claim that Americans at the fifth and tenth percentiles are much better off today than they were in 1967. Those at the tenth percentile are counted as poor only because the poverty measure is flawed. However, the estimates in Figure 1 for the second percentile also support Edin and Shaefer’s claim that the poorest of the poor were a lot worse off in 2012 than in either 1996 or 1999. Had the federal government not handed their fate back to the states in 1996, these families might still be as well off as they were in 1999. That is not the kind of speculation that can be either verified or refuted; but it is worth serious consideration nonetheless.

-
1
See “The War on Poverty: Was It Lost?,” April 2, 2015. ↩
-
2
Full disclosure: I chaired Edin’s dissertation committee when she was a doctoral student at Northwestern University and wrote an introduction to her book with Laura Lein, Making Ends Meet: How Single Mothers Survive Welfare and Low-Wage Work (Russell Sage, 1997). I had no part in $2.00 a Day and learned of its existence only a few weeks before it was published. ↩
-
3
Families have traditionally reported somewhat more income to SIPP than to other Census surveys. SIPP interviews participants every four months rather than once a year, and survey respondents are more likely to recall small amounts of income received at irregular intervals within the past few months than to recall similar amounts received a year before. ↩
-
4
According to the World Bank, 12.7 percent of the world population lived on less than $1.90 a day per person in 2012; see www.worldbank.org/en/topic/poverty/overview. ↩
-
5
See Luke Shaefer and Kathryn Edin, “What Is the Evidence of Worsening Conditions Among America’s Poorest Families with Children?,” March 2, 2016. ↩
-
6
The less income food stamp applicants or recipients report, the more free food they get. Unlike SIPP respondents, therefore, food stamp recipients have an incentive to underreport their income. However, underreporting income can be risky for food stamp recipients. Employers have to report wage payments to the state in which their employee works. That makes it easy to identify food stamp recipients who fail to report all their earnings. Once detected, such a failure can lead to the loss of all food stamp benefits. ↩
-
7
Andrea Hetling, Jinwoo Kwon, and Correne Saunders present more detailed evidence on how TANF rules affect the number of mothers with no income in their paper “The Relationship Between State Welfare Rules and Economic Disconnection Among Low-Income Single Mothers,” Social Service Review, Vol. 89, No. 4 (December 2015). ↩
-
8
See the Center on Budget and Policy Priorities, “Chart Book: TANF at 19,” March 29, 2016, p. 3 . ↩
-
9
Fox and Wimer extended existing estimates of federal and state taxes and noncash benefits back to 1967. Some of these estimates are fairly rough approximations. They then subtracted taxes from the Annual Social and Economic supplement (ASEC) estimate of each household’s pretax money income for the previous calendar year and added the estimated value of each household’s means-tested noncash benefits and the value of its EITC refund (if any) to get what I am calling “household resources.” At my request Wimer then divided this total by the square root of household size to adjust for size-based differences in households’ economic needs. Finally, we converted this total to 2012 dollars using the Consumer Price Index Research Series (CPI–U–RS). ↩
