


Imagine a giant vacuum cleaner looming over America’s economy, drawing dollars from its bottom to its upper tiers. Using US Census reports, I estimate that since 1985, the lower 60 percent of households have lost $4 trillion, most of which has ascended to the top 5 percent, including a growing tier now taking in $1 million or more each year.1 Some of our founders foresaw this happening. “Society naturally divides itself,” Alexander Hamilton wrote in The Federalist, “into the very few and the many.” His coauthor, James Madison, identified the cause. “Unequal faculties of acquiring property,” he said, inhere in every human grouping. If affluence results from inner aptitudes, it might seem futile to try reining in the rich.
All four of the books under review reject Hamilton and Madison’s premises. All are informative, original, and offer unusual insights. None accepts that social divisions are inevitable or natural, and all make coherent arguments in favor of less inequality, supported by persuasive statistics.
1.
The Spirit Level is a prodigious empirical effort directed to a moral purpose. It ranks the quality of life in twenty-three countries, mainly European, but with Singapore, Israel, and the United States also on the list. To evaluate the well-being of each society, Richard Wilkinson and Kate Pickett use indices ranging from obesity and incarceration rates to teenage births and the feelings people have about their fellow countrymen. They then relate these variables to how income is distributed in each society. Here they deploy the Gini ratio, a three-digit coefficient purporting to measure the extent of income inequality within any grouping for which figures are available. Their national Gini scores range from .230 in egalitarian Sweden to .478 in highly stratified Singapore, with the United States second highest at .450. Linking social indicators to economic disparities, the authors conclude that “reducing inequality is the best way of improving the quality of the social environment.”
As income gaps grow, they write, it’s not only the poor who suffer. Unequal societies not only bear “diseases of poverty,” but also “diseases of affluence.” The latter include cancer and cardiovascular disease as well as the afflictions of well-off people who are “anxiety-ridden,” “prone to depression,” and “seek comfort in overeating, obsessive shopping and spending.” At this point, as elsewhere, the authors tend to get carried away. I’m not sure I’m ready to rank compulsive spending or eating too much as diseases. Even so, Wilkinson and Pickett are blunt in their summary: “inequality is socially corrosive.” What’s missing in their analysis is how far, if at all, income disparities may also degrade the deprived.
The authors don’t go so far as to say that people with above-average incomes would end up better off were they to take home less money, and if greater numbers of their poor compatriots had more. But they do contend that “the benefits of greater equality seem to be shared across the vast majority of the population.” Thus one of their tables shows that those in the middle class in more egalitarian England have lower rates of cancer and diabetes than their counterparts in the United States. American children don’t perform as well academically as their peers in Finland and Belgium, where incomes are not as widely spread.
The broader argument was made by Oliver Wendell Holmes, who reputedly told one of his clerks that taxation is how we “buy civilization.” Lower Gini scores generally tell us that the business and professional classes of such countries as Norway and Denmark consent to higher tax rates because publicly provided higher education and health care and cultural amenities make for a more congenial society, in which everyone shares.
Wilkinson and Pickett teach at Britain’s University of York, and they aim for an international audience. Yet they seem to have America mainly in mind when they remark that “instead of a better society, the only thing almost everyone strives for is to better their own position.” Here too we’re into hyperbole. The United States has a large stratum of professionals who choose public service careers; indeed much, even most, of the middle class doesn’t set its sights on more than routine personal advancement. Still, it’s appropriate to ask how many of the rich care about creating a “better society.” Wealth brings higher-quality health care, private schooling, and personal pension plans, along with shielding from lines, crowds, and captious service.
Like many modern studies, most of the findings in The Spirit Level derive from statistical formulations. I found myself wanting to know more about the actual people represented by indicators and indices. In Belgium, taxes take 42 percent of an average worker’s earnings, compared with 23 percent in the United States; in Denmark, personal income taxes absorb 27 percent of its gross domestic product, against 8 percent in the US. How do their middle-class professionals balance the public and private in their conceptions of the good life? Do they, for example, feel that high take-home pay is needed to bring out people’s best efforts? “We see no indication,” Wilkinson and Pickett say, “that standards of intellectual, artistic or sporting achievement are lower in the more equal societies.” And as a measure of innovation, they show that such countries file more patents per capita. But they don’t consider keenly competitive enterprises—such as Apple and Facebook—from which Forbes 400 fortunes grow. We hear it claimed that innovations such as iPhones and iPads are much encouraged by hopes of inordinate wealth. Is there an egalitarian alternative?
Advertisement
There’s a limitation to the Gini ratio that the authors don’t mention. Because Spain (.320) and Canada (.321) are so close in Gini ratio, The Spirit Level would have us conclude they have comparable levels of income. But similar scores can conceal quite different distributions of income. Unfortunately, Wilkinson and Pickett don’t explain why. For example, the Gini ratios for New Hampshire (.425) and Iowa (.427) make them relatively egalitarian on the American spectrum. However, New Hampshire gets there by having the same number of high- and low-income households: 26 percent have annual income over $100,000 with 26 percent under $35,000. Iowa has almost the same ratio, but only 15 percent of its households make above $100,000 and 36 percent fall below $35,000. The Spirit Level’s message is that if countries want a more equable and equitable society, they should move toward closing their income gaps. But what can we say about Iowa’s equality if it still has a substantial low-income segment? Reducing the proportion of the rich may be a pyrrhic victory if poverty persists.
2.
To say that America’s rich are getting richer, which is true, is only part of the story. Also important is that considerably more Americans are now enjoying an affluence that was once the preserve of only a very small stratum. Despite Occupy Wall Street’s focus on the wealthiest one percent, the rise of two other groups tells us more about recent redistributions. The first consists of households having annual incomes of $1 million or more, a passable definition of “rich.” (Entry to the top 1 percent now comes with $347,421, which I’d simply call comfortably off.)
As can be seen in Table A, in 1972, altogether 22,887 tax returns were filed with today’s equivalent of $1 million in income. By 1985, the number had expanded to 58,603. And in 2009, the most recent year for figures, this bracket had multiplied to 236,893. In 1972, for every $1 million household there were 3,393 earning less. Now for every $1 million household there are only 591 with less. True, the population has grown since 1972, as has the overall income pool. But not nearly enough to explain the expansion at the top.

Moreover, the $1 million (and up) in the three illustrative years was the amount these taxpayers declared as gross income; that is, before they paid taxes to the IRS. As is also shown in Table A, the share of income paid in taxes by this group has declined markedly. In 1972, households in the $1 million bracket kept 53 percent of what they declared. Today, they retain 75 percent for personal purchases and pleasures. There would still be more rich Americans if their taxes hadn’t been reduced, due to the rise in salaries and other sources of wealth at the top. But those abatements have allowed the kind of gilded lives not known for over a century.
Where did all these earners of $1 million incomes come from? Many are owners of small but prosperous businesses. But even with high-tech start-ups, we don’t have more fledgling enterprises than in the past. In fact, the greatest growth in high incomes has been in “financial services.” Here what’s bought and sold largely amounts to advice, about when people should buy and sell financial holdings, or have holdings bought and sold for them, as with public offerings and investing pension funds.
Financial services also includes devising algorithms for complex securities, like credit default swaps and collateralized debt obligations. In either case, what’s being created often seems so arcane that clients don’t object to eight-digit fees, which are in turn bestowed as seven-figure bonuses. Or they don’t cavil at such payments because they intend to do well themselves. According to Adam Smith, we should expect competitors to emerge, offering the same services at palpably lower fees. While this sometimes happens, customers tend to feel safer with well-known names, including Bear Stearns and Lehman Brothers, until their days of reckoning.
The wish to focus on millionaires is understandable. But the upward movement of money has in fact benefited a second and considerably larger group, the best-paid 5 percent, which includes some four million families. As Table A shows, this group’s real earnings have more than doubled since 1972, while its share of aggregate income has grown by almost a quarter. As Table A also notes, it now takes about $200,000 a year to join this tier. In my view, this stratum warrants at least as much attention as the superrich, not just because there are more of them, but because their paychecks tell us a lot about an emerging pattern of rewards.
Advertisement
Robert Frank’s The Darwin Economy and Thomas Edsall’s The Age of Austerity provide much-needed information and analysis to explain why so much of the nation’s money is flowing upward. Frank, an economist at Cornell, draws on social psychology to shatter many myths about competition and compensation. While he doesn’t explicitly cite the classical French economist Jean-Baptiste Say, much in his exposition echoes Say’s axiom that “supply creates demand.” This doesn’t mean that if items are put on display, people will automatically buy them. Consumers decide what or if they’ll purchase, and clearly can only do so if they have the credit or money. Even so, the items they decide they want have been created by the suppliers, who put things on the shelves.
Frank carries this a step further. In recent years, he argues, the products and enjoyments set before us have become increasingly enticing—including houses, vacations, television programs, video games, electronic devices, and the attractions of the Internet. In many cases, the rich acquire them first; since what they have and do becomes widely known, emulation descends down the line.
Nor are these just Tiffany trinkets. Frank’s most vivid examples are newly built houses. As the very rich installed grander entrance halls and rarely used bathrooms, the professional classes felt they should have a semblance of such amenities. “By 2007,” Frank writes, “the median new single-family house built in the United States had an area of more than 2,300 square feet, some 50 percent more than its counterpart from 1970.” Indeed, it’s revealing that this expansion was happening as people were having fewer children. However, these homes—along with more elaborate wardrobes, holidays, and technical gear—are costly. If they were to be bought, salaries needed to keep pace.
Hence, I would argue, an unstated but still real compact was made between the employers and the new upper-middle class. Their pay would be raised to support their ascending status. As the samplings in Table B show, while real earnings for the overall workforce have risen only 7 percent since 1985, professions like physicians and professors have done several times better. Incomes of lawyers and executives, for their part, have soared much further than anyone would have forecast a few decades ago.2
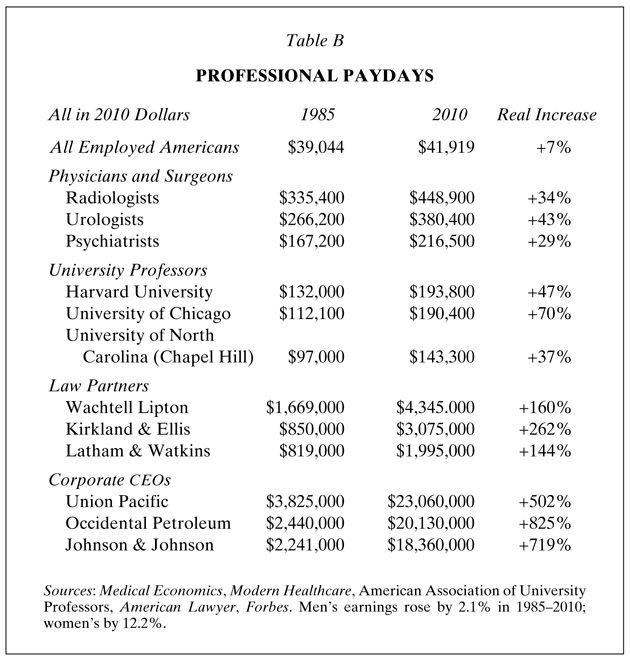
Rationales aren’t lacking for these raises. One is that skills and talents are in short supply for such jobs as video game designers, so higher pay must be proffered to get and keep the better performers. But a more plausible reason is that money to push up pay was becoming available as profits generally increased, and lower-level jobs were increasingly performed by workers abroad. So a tacit compact came into play. Health plans gave doctors most of what they billed, with few questions asked. Colleges, knowing that parents would pay, found they could increase tuition and fees, much of which went to boost the pay of those fortunate to be full-time faculty. Corporate clients didn’t object to higher legal fees, at least for top partners, since their overall labor costs were less.
Here Thomas Edsall provides useful information. “US multinational corporations cut domestic employment by 2.9 million during the 2000s, while adding 2.4 million workers overseas,” he writes. At the same time, “recession-forced layoffs resulted in increased productivity, which in turn translated into higher profits with fewer workers.” In this setting, clubby corporate boards approved eight-figure pay packages to their CEOs, which were seen as affirming the stature of their firms. In these and other instances, accepted standards for corporate compensation went by the board. No one asked what might be a competitive rate for whatever skills were needed; or if there might be equally talented people who would do just as good a job for less.
The crucial fact is that the upward flow of money has reduced the spending power of those lower down, most notably the bottom 60 percent. This loss has had consequences. For example, in a not-so-distant past, families of modest means made enough to put something aside for their children’s college fees. That cushion is gone, which is why millions of undergraduates are now forced to take much larger loans. Adding interest and penalties, many will face decades paying off six-figure debts. By way of contrast, parents in the top 5 percent can write full tuition checks, which gives their children an edge in admissions decisions, even if colleges deny this.3
3.
James Gilligan has written a quirky book that deserves to be taken seriously. His exposition is based primarily on public statistics, and he uses the numbers responsibly, always allowing for alternative interpretations. His book isn’t explicitly about economic inequality, but something graver: death, and its two most dramatic causes, suicide and homicide. Yet even here, how the economy functions is crucial. Gilligan starts with figures on these two ways life may end, for which we have reliable records going back to 1900. The numbers start with county coroners, are forwarded to state health agencies, and are finally collated in federal reports. To be sure, not all deaths have clear-cut causes. We can’t always be sure if ingesting too many pills was accidental or intentional, just as a road fatality can be a means of suicide. Gilligan is aware of ambiguities like these and factors them into his equations.
Still, his initial step may raise some questions. For each year starting with 1900, he adds homicide and suicide rates together to yield a “violent death rate,” which becomes the principal variable in his analysis. True, a carbon monoxide suicide is in a sense a violent act; but it’s not in the same category as plunging a knife into someone else’s chest. Gilligan acknowledges the differences in the two kinds of deaths, but they also overlap. At least a few of those who choose to carry lethal weapons know they are rolling dice with their own lives.
The two modes of death involve different groups of people. In 2007, the most recent for figures, there were 34,598 suicides and 18,361 homicides. As it happens, men accounted for precisely 79 percent of both groups of victims. However, relative to their numbers, whites were almost three times as likely as blacks to take their own lives, while blacks had an eight times greater chance of being killed by someone else. Altogether, 56 percent of the men used firearms to end their lives; so did 30 percent of the women.
What makes Gilligan’s analysis interesting is his view that the two forms of death have many parallels. Suicide, he argues, may be seen as “self-punishment,” the sternest possible reproof, but inflicted on oneself. In a not wholly dissimilar vein, “aggressive behavior toward other people, which can escalate to homicide,” is often impelled by resentment over not receiving respect felt to be one’s due. (Shots have been fired over parking spaces.) Both sets of feelings are exacerbated, Gilligan argues, when social conditions swell the pool of people who are made to feel “worthless,” “shamed,” and “redundant.”
According to his calculations, “epidemics of lethal violence” are closely correlated with the party affiliation of the president. In the 107 years following 1900, Republicans held the White House for fifty-nine of them, leaving forty-eight for Democrats. He found that for all but fourteen of the 107 years, his combined homicide-suicide rate fell when Democrats were president and rose under Republican administrations. (Eisenhower and Carter accounted for twelve of the fourteen exceptional years.)
Gilligan’s most specific surmise is that these linkages result largely from unemployment, which tends to rise under Republican presidents. An inability to find a job, he says, is the foremost driver of feelings of shame and worthlessness. (If this pattern persists, unemployment and violence-related deaths will rise even further if we have a President Romney.) It’s obvious that the 52,959 suicides and homicides recorded in 2007 were a minute fraction of the seven million out of work that year. Gilligan, a professor of psychiatry at NYU, conjectures that “they are the tip of the iceberg…underneath which are many times more people who suffer grievously from these stresses but do not respond to them by killing others or themselves.”
Gilligan also shows that states usually carried by Republicans have higher homicide and suicide rates, as well as inflicting more deaths in the form of executions. But he doesn’t relate this to the job market in these states—an important omission. He considers another explanation. Republicans muster their majorities from just above the median, pitting “members of the lower middle class against the very poorest lower class.” So when they take power, they are basically telling Americans who are first to be fired that they no longer count. What I take Gilligan to be saying is that those who are subject to the humiliations of being poor at least sense that when a Democrat is in the White House someone there cares more than would be the case if there were a Republican. This is class analysis with a new twist.
Well, we now have a Democratic president, with three years of high jobless rates. We don’t yet have suicide statistics for 2009 and 2010. But figures for homicides are available from the FBI, which collects them from local police departments. In 2009, the national rate for the FBI combined “murder and manslaughter” rate was 5.0 per 100,000 in the population, and in 2010 it dropped to 4.8 per 100,000. By way of contrast, those rates during George W. Bush’s eight years averaged 5.6 per 100,000. Thus far Gilligan’s inferences are standing up. Despite disheartening levels of unemployment, having a Democratic administration correlates with a moderately declining murder rate.
While Gilligan doesn’t discuss income inequality explicitly, he argues that one of our major parties has no real concern for those below the economic median. Here his book complements the other three. If the Republicans win the presidency, it will be largely with votes from the upper half of the electorate, which provided their needed margin in the 2010 contests.4 Using this base, the GOP claims that the rich must be cosseted because they are “job creators.”
What isn’t said is that its business supporters seek the cheapest possible workforce—domestic, immigrant, or foreign—because bonuses and profits rise when payroll costs are low. If this strategy succeeds, the Americans who are most desperate for jobs will face a future as casual labor. (The college “adjuncts” who are poorly paid to do much of the teaching formerly done by upper-middle-class professors are one white-collar harbinger.) Like other overleveraged nations, the US may well be facing Thomas Edsall’s “age of austerity.” If so, it remains to ask who will be making most of the sacrifices. Americans have votes and voices; much of the decision will rest with them.

-
1
See www.census.gov/hhes/www/income/data/historical/household, Tables H-1 and H-17. All 1985–2010 amounts are in 2010-value dollars. ↩
-
2
Frank argues that Darwin’s natural selection better explains the results of competition than Smith’s invisible hand. To underwrite the “common good”—for which he finds scant concern in Darwin—he would impose onerous taxes on “positional” (i.e., conspicuous) consumption like lavish “weddings and coming-of-age parties.” ↩
-
3
According to The Princeton Review, of the 15,141 students admitted by ten highly competitive colleges last year (the Ivy League plus Stanford and Duke), 48.8 percent were able to pay the full bill, which averaged $53,158. ↩
-
4
See my “The Next Election: The Surprising Reality,” The New York Review, August 18, 2011. ↩
